基于大气污染累积健康风险的天津市空气质量健康指数研究
摘要:
背景
累积风险指数(CRI)可综合考虑多种大气污染物对健康的联合作用,但目前罕见基于大气污染CRI构建空气质量健康指数(AQHI)的研究。
目的
基于大气污染物CRI构建天津市AQHI并对其有效性进行验证。
方法
收集天津市2015—2019年每日大气污染、气象因素、非意外死亡数据,并建立时间序列数据库,采用描述性统计分析方法对数据的基本分布特征进行分析。采用广义相加模型的单污染物模型和双污染物模型建立大气污染物与非意外死亡的暴露反应关系,筛选最佳滞后天数和指示污染物,然后采用多污染物模型计算大气污染的CRI值,并依据CRI值构建AQHI并分级。最后采用广义相加模型分别建立AQHI和空气质量指数(AQI)与非意外死亡的暴露反应关系,并对暴露反应关系系数进行比较,以广义交叉验证(GCV)值和模型的R2对AQHI的有效性进行验证。
结果
本研究选择lag1为最佳滞后天数,在综合考虑超标情况和统计学模型结果的基础上,选择PM2.5、SO2、NO2和O3作为最终的指示污染物。4种指示污染物的浓度每升高1 μg·m−3对非意外死亡影响的效应值b,分别为−0.00002、0.00079、0.00015和0.00042。基于上述系数计算CRI,并构建AQHI。按照分级标准提示,63%的时间是处于低风险级别,有34%的时间处于中风险级别。分别建立了AQHI和AQI与全人群、女性人群和男性人群非意外死亡的暴露反应关系,结果显示,AQHI每增加一个四分位数间距(IQR),全人群、女性人群和男性人群非意外死亡的超额风险均高于AQI的相应指标值;且AQHI模型的GCV值(分别为2.694、1.819、1.938)均低于AQI模型的GCV值(分别为2.747、1.850、1.961),AQHI模型的R2值(分别为0.849、0.780、0.820)均高于AQI模型的R2值(分别为0.846、0.776、0.817)。
结论
与AQI相比,基于大气污染物的CRI构建的AQHI能够较好地预测天津市空气污染对人群的健康风险。
Abstract:
Background
Cumulative risk index (CRI), as a commonly used approach to estimate the joint effects of multiple air pollutants on health, has been used by few studies to construct an air quality health index (AQHI).
Objective
To construct an AQHI based on the CRI of air pollution in Tianjin and evaluate the validity of the AQHI.
Methods
Daily data on air pollutants, meteorological factors, and non-accidental deaths during 2015–2019 in Tianjin were collected to create a time-series object. Descriptive statistical analyses were used to describe the characteristics of the data. To determine the best lag day and indicative pollutant, single-pollutant and two-pollutant generalized additive models were fitted to construct the exposure-response relationships between air pollutants and non-accidental deaths. After that we evaluated a CRI of air pollution using multi-pollutant models and constructed an AQHI and its classifications based on the CRI. Finally, we compared the exposure-response associations and coefficients of the AQHI and the conventional air quality index (AQI) with non-accidental deaths, and evaluated the health risk communication validity of the AQHI using generalized cross validation (GCV) values and R2 values.
Results
We selected lag1 as the best lag day and PM2.5, SO2, NO2 and O3 as the appropriate pollutants according to the unqualified rates of pollutants and significant statistical results. One μg·m−3 increase of PM2.5, SO2, NO2, and O3 was associated with −0.00002, 0.00079, 0.00015, and 0.00042 increase in effect size b of the non-accidental mortality, respectively. Based on these coefficients, we calculated the CRI and AQHI. According to a pre-determined classification scheme of the AQHI, the air quality of 63% study days was low risks and that of 34% study days was median risks. The associations of AQHI and AQI with non-accidental deaths in different populations were evaluated. The results showed that the excess risks of non-accidental deaths in total, female, and male populations for per interquartile range (IQR) increase in AQHI were higher than the corresponding values of AQI. The GCV values of the AQHI model (2.694, 1.819, and 1.938, respectively) were lower than those of the AQI model (2.747, 1.850, and 1.961, respectively), and the R2 values of the AQHI model (0.849, 0.780, and 0.820, respectively) were higher than those of the AQI model (0.846, 0.776, and 0.817, respectively).
Conclusion
Compared with AQI, the CRI-based AQHI may communicate the air pollution-related health risk to the public more effectively in Tianjin.
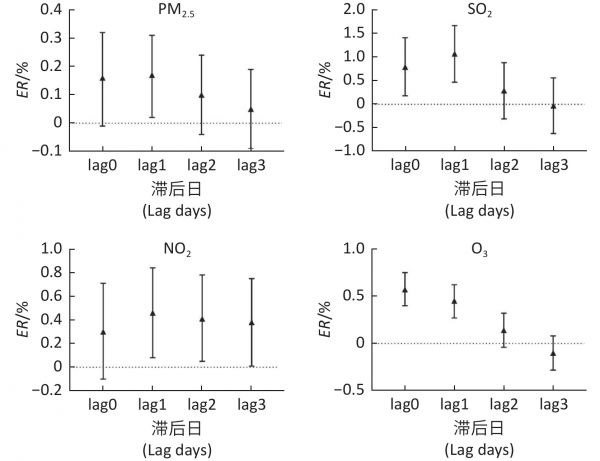
图 1 天津市2015—2019年各大气污染物不同滞后日的日均浓度每升高10 μg·m−3对非意外死亡影响的单污染物模型效应图
Figure 1. Percent changes of excess risk in non-accidental deaths for a 10 μg·m−3 increase in daily average air pollutant concentrations at different lag days in single-pollutant models in Tianjin, China, 2015–2019
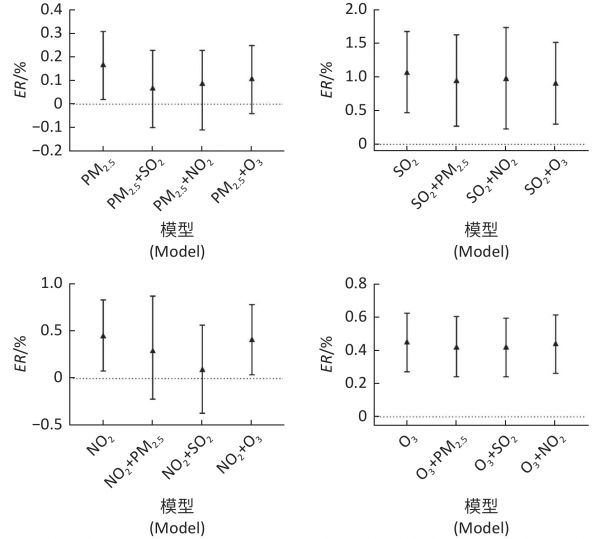
图 2 天津市2015—2019年各大气污染物在lag1天的日均浓度每升高10 μg·m−3对非意外死亡影响的双污染物模型效应图
Figure 2. Percent changes of excess risk in non-accidental deaths for a 10 μg·m−3 increase in daily average air pollutant concentrations at lag 1 in two-pollutant models in Tianjin, China, 2015–2019
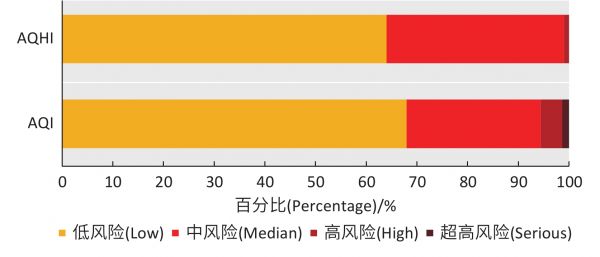
图 3 AQHI和AQI的各风险等级比例分布图
Figure 3. The distribution of health risk percentages of AQHI and AQI
表 1 天津市2015—2019年日非意外死亡数、日均温度和相对湿度以及大气污染物日均浓度的分布特征
Table 1 Distribution characteristics of daily averages of non-accidental death counts, temperature, relative humidity, and air pollutant concentrations in Tianjin, China, 2015–2019
变量(Variable)均数±标准差(Mean±SD)最小值(Minimum)中位数(Median)最大值(Maximum)四分位数
间距(IQR) 每日非意外死亡人数(Daily non-accidental death counts) 合计(Total) 154.0 ± 52.1 2.0 132.0 312.0 85.0 男性(Male) 85.3± 30.1 1.0 74.0 180.0 49.0 女性(Female) 68.6± 23.6 1.0 62.0 151.0 36.0 日均温度/℃
(Daily average temperature/℃) 13.9 ± 11.3 −16.0 15.7 34.0 21.0 日均相对湿度/%
(Daily average relative humidity/%) 55.2 ± 19.1 12.0 55.0 100.0 30.0 PM2.5/(µg·m−3) 61.5 ± 48.3 6.0 47.9 367.5 47.1 SO2/(µg·m−3) 18.3 ± 19.2 2.0 12.6 216.4 13.8 NO2/(µg·m−3) 44.6 ± 21.8 8.1 39.5 167.6 28.4 O3/(µg·m−3) 114.5 ± 65.9 2.7 102.1 348.7 96.4 AQI 93.8 ± 55.7 17.0 80.0 437.0 54.0
表 2 天津市2015—2019年各大气污染物之间的相关关系(rs)
Table 2 Spearman correlation coefficients for included air pollutants in Tianjin, China, 2015–2019 (rs)
变量(Variable)PM2.5SO2NO2O3 PM2.51.0000SO20.5632*1.0000NO20.5835*0.7030*1.0000O3−0.0680*−0.3526*−0.4482*1.0000 [注(Note)] *:P<0.01。表 3 天津市2015—2019年大气污染物的CRI和AQHI的分布特征
Table 3 Distribution characteristics of CRI and AQHI for included air pollutants in Tianjin, China, 2015–2019
变量名称(Variable)均数±标准差
(Mean±SD)最小值
(Minimum)中位数
(Median)最大值
(Maximum)四分位数间距
(IQR) CRI1.07±0.031.021.071.220.04AQHI3.20±1.290.793.0410.001.86
表 4 AQHI和AQI对天津市全人群、女性人群和男性人群非意外死亡超额风险的预测比较
Table 4 Comparisons of excess risk in non-accidental deaths among total, female, and male populations for AQHI and AQI
变量(Variable)ER(95%CI)/%PGCVR2 AQHI 全人群(All)4.37(3.06~5.69)<0.0012.6940.849 女性(Female)5.10(3.47~6.75)<0.0011.8190.780 男性(Male)3.69(2.20~5.20)<0.0011.9380.820AQI 全人群(All)0.84(0.13~1.60)0.0212.7470.846 女性(Female)1.10(0.21~1.99)0.0151.8500.776 男性(Male)0.63(-0.20~1.46)0.1341.9610.817 [1]GBD 2017 Risk Factor Collaborators. Global, regional, and national comparative risk assessment of 84 behavioural, environmental and occupational, and metabolic risks or clusters of risks for 195 countries and territories, 1990-2017: a systematic analysis for the Global Burden of Disease Study 2017[J]. Lancet, 2018, 392(10159): 1923-1994. doi: 10.1016/S0140-6736(18)32225-6
[2]HU J, YING Q, WANG Y, et al. Characterizing multi-pollutant air pollution in China: Comparison of three air quality indices[J]. Environ Int, 2015, 84: 17-25. doi: 10.1016/j.envint.2015.06.014
[3]QIAO X, JAFFE D, TANG Y, et al. Evaluation of air quality in Chengdu, Sichuan Basin, China: are China's air quality standards sufficient yet?[J]. Environ Monit Assess, 2015, 187(5): 250. doi: 10.1007/s10661-015-4500-z
[4]STIEB DM, BURNETT RT, SMITH-DOIRON M, et al. A new multipollutant, no-threshold air quality health index based on short-term associations observed in daily time-series analyses[J]. J Air Waste Manag Assoc, 2008, 58(3): 435-450. doi: 10.3155/1047-3289.58.3.435
[5]CHEN L, VILLENEUVE, ROWE B H, et al. The Air Quality Health Index as a predictor of emergency department visits for ischemic stroke in Edmonton, Canada[J]. J Expo Sci Environ Epidemiol, 2014, 24(4): 358-364. doi: 10.1038/jes.2013.82
[6]CHEN R, WANG X, MENG X, et al. Communicating air pollution-related health risks to the public: an application of the Air Quality Health Index in Shanghai, China[J]. Environ Int, 2013, 51: 168-173. doi: 10.1016/j.envint.2012.11.008
[7]DU X, CHEN R, MENG X, et al. The establishment of national air quality health Index in China[J]. Environ Int, 2020, 138: 105594. doi: 10.1016/j.envint.2020.105594
[8]OLSTRUP H, JOHANSSON C, FORSBERG B, et al. A multi-pollutant air quality health index (AQHI) based on short-term respiratory effects in Stockholm, Sweden[J]. Int J Environ Res Public Health, 2019, 16(1): 105. doi: 10.3390/ijerph16010105
[9]ROBERTS S. A new model for investigating the mortality effects of multiple air pollutants in air pollution mortality time-series studies[J]. J Toxicol Environ Health Part A, 2006, 69(6): 417-435. doi: 10.1080/15287390500246761
[10]ZENG Q, FAN L, NI Y, et al. Construction of AQHI based on the exposure relationship between air pollution and YLL in northern China[J]. Sci Total Environ, 2020, 710: 136264. doi: 10.1016/j.scitotenv.2019.136264
[11]CAO R, WANG Y, HUANG J, et al. The construction of the air quality health index (AQHI) and a validity comparison based on three different methods[J]. Environ Res, 2021, 197: 110987. doi: 10.1016/j.envres.2021.110987
[12]XU H, ZENG W, GUO B, et al. Improved risk communications with a Bayesian multipollutant Air Quality Health Index[J]. Sci Total Environ, 2020, 722: 137892. doi: 10.1016/j.scitotenv.2020.137892
[13]LIPPMANN M, CHEN L C, GORDON T, et al. National Particle Component Toxicity (NPACT) Initiative: integrated epidemiologic and toxicologic studies of the health effects of particulate matter components[J]. Res Rep Health Eff Inst, 2013(177): 5-13.
[14]ZENG Q, NI Y, JIANG G, et al. The short term burden of ambient particulate matters on non-accidental mortality and years of life lost: A ten-year multi-district study in Tianjin, China[J]. Environ Pollut, 2017, 220: 713-719. doi: 10.1016/j.envpol.2016.10.036
[15]LI X, XIAO J, LIN H, et al. The construction and validity analysis of AQHI based on mortality risk: A case study in Guangzhou, China[J]. Environ Pollut, 2017, 220: 487-494. doi: 10.1016/j.envpol.2016.09.091
[16] 王文韬, 孙庆华, 覃健, 等. 中国5个城市2013-2015年空气质量健康指数模拟研究[J]. 中华流行病学杂志, 2017, 38(3): 314-319. doi: 10.3760/cma.j.issn.0254-6450.2017.03.008WANG W T, SUN Q H, Qin J, et al. Simulation study of air quality health index in 5 cities in China: 2013—2015[J]. Chin J Epidemiol, 2017, 38(3): 314-319. doi: 10.3760/cma.j.issn.0254-6450.2017.03.008
[17] 张莉君, 许慧慧, 朱凤鸣, 等. 上海市儿童呼吸系统疾病空气质量健康指数的建立[J]. 环境与职业医学, 2022, 39(7): 730-736. doi: 10.11836/JEOM21417ZHANG L J, XU H H, ZHU F M, et al. Construction of an air quality health index for pediatric respiratory diseases in Shanghai[J]. J Environ Occup Med, 2022, 39(7): 730-736. doi: 10.11836/JEOM21417
[18] 樊琳, 倪洋, 曾强, 等. 基于五类空气质量指数的天津市环境空气质量评价[J]. 环境与健康杂志, 2018, 35(9): 803-808. doi: 10.16241/j.cnki.1001-5914.2018.09.013FAN L, NI Y, ZENG Q, et al. Air quality assessment based on five kinds of air quality indexes in Tianjin[J]. J Environ Health, 2018, 35(9): 803-808. doi: 10.16241/j.cnki.1001-5914.2018.09.013
[19] 陈仁杰, 陈秉衡, 阚海东. 上海市空气质量健康指数的构建及其应用[J]. 中华预防医学杂志, 2012, 46(5): 443-446. doi: 10.3760/cma.j.issn.0253-9624.2012.05.014CHEN R J, CHEN B H, KAN H D. The establishment and application of Shanghai air quality health index[J]. Chin J Prev Med, 2012, 46(5): 443-446. doi: 10.3760/cma.j.issn.0253-9624.2012.05.014
[20]JERRETT M, BURNETT R T, BECKERMAN B S, et al. Spatial analysis of air pollution and mortality in California[J]. Am J Respir Crit Care Med, 2013, 188(5): 593-599. doi: 10.1164/rccm.201303-0609OC
相关知识
环境空气污染居民健康风险评价
前沿|研究发现极低水平的空气污染也会产生较大健康风险
空气污染治理与健康影响研究
大气化学团队联合研究提出基于气溶胶人群暴露健康风险的污染防控机制
公众对城市大气污染的健康防护行为研究
基于空间计量方法的我国城市空气质量与居民健康的关系研究
聚焦城市化背景下大气环境健康风险研究
全球携手应对空气污染健康风险
大气污染对居民健康影响研究进展
基于健康保护的环境空气质量标准研究取得新进展
网址: 基于大气污染累积健康风险的天津市空气质量健康指数研究 https://m.trfsz.com/newsview1539054.html